Language: A Cluster Analysis of Reality

Cluster analysis is the process of quantitatively grouping data in such a way that observations in the same group are more similar to each other than to those in other groups. This image should clear it up.

Whenever you do a cluster analysis, you do it on a specific set of variables: for example, I could cluster a set of customers against the two variables of satisfaction and brand loyalty. In that analysis, I might identify four clusters: (loyalty:high, satisfaction:low), (loyalty:low, satisfaction:low), (loyalty:high, satisfaction:high), and (loyalty:low, satisfaction:high). I might then label these four clusters to identify their characteristics for easy reference: “supporters”, “alienated”, “fans” and “roamers”, respectively.

What does that have to do with language?

Let’s take a word, “human”. If I define “human” as “featherless biped”, I’m effectively doing three things. One, I’m clustering an n-dimensional “reality-space”, which contains all the things in the universe graphed according to their properties, against the two variables ‘feathered’ and ‘bipedal’. Two, I’m pointing to the cluster of things which are (feathered:false, bipedal:true). Three, I’m labeling that cluster “human”.

This, the Aristotelian definition of “human”, isn’t very specific. It’s only clustering reality-space on two variables, so it ends up including some things that shouldn’t actually belong in the cluster, like apes and plucked chickens. Still, it’s good enough for most practical purposes, and assuming there aren’t any apes or plucked chickens around, it’ll help you to identify humans as separate from other things, like houses, vases, sandwiches, cats, colors, and mathematical theorems.

If we wanted to be more specific with our “human” definition, we could add a few more dimensions to our cluster analysis—add a few more attributes to our definition—and remove those outliers. For example, we might define “human” as “featherless bipedal mammals with red blood and 23 pairs of chromosomes, who reproduce sexually and use syntactical combinatorial language”. Now, we’re clustering reality-space against seven dimensions, instead of just two, and we get a more accurate analysis.

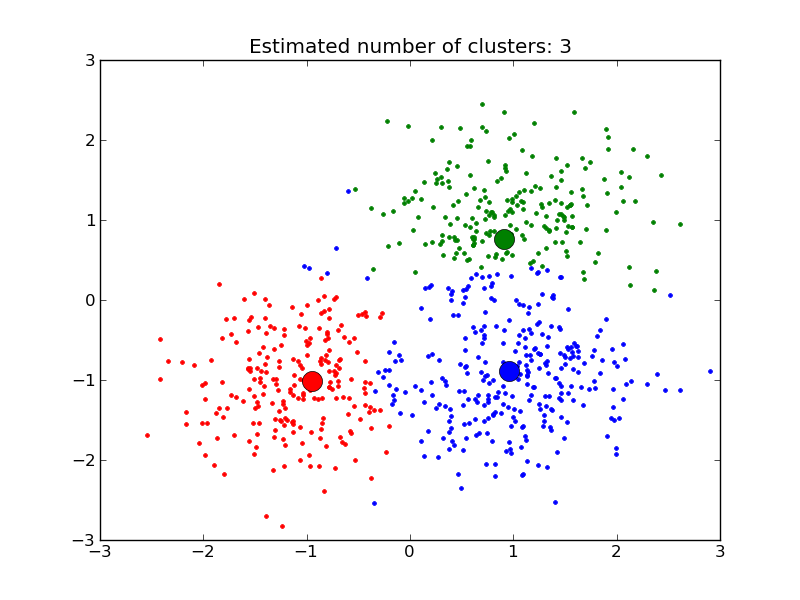
Despite this, we really can’t create a complete list of all the things that most real categories have in common. Our generalizations are leaky in some way, around the edges: our analyses aren’t perfect. (This is absolutely the case with every other cluster analysis, too.) There are always observations at the edges that might be in any number of clusters. Take a look at the graph above in this post. Those blue points at the top left edge, should they really be blue, or red or green instead? Are there really three clusters, or would it be more useful to say there are two, or four, or seven?

We make these decisions when we define words, too. Deciding which cluster to place an observation happens all the time with colors: is it red or orange, blue or green? Splitting one cluster into many happens when we need to split a word in order to convey more specific meaning: for example, “person” trisects into “human”, “alien”, and “AI”. Maybe you could split the “person” cluster even further than that. On the other end, you combine two categories into one when sub-cluster distinctions don’t matter for a certain purpose. The base-level category “table” substitutes more specific terms like “dining table” and “kotatsu” when the specifics don’t matter.

You can do a cluster analysis objectively wrong. There is math, and if the math says you’re wrong, you’re wrong. If your WCSS is so high that you have a cluster that you can’t label more distinctly than “everything else”, or if it’s so low you’ve segregated your clusters beyond the point of usefulness, then you’ve done it wrong.

Many people think “you can define a word any way you like”, but this doesn’t make sense. Words are cluster analyses of reality-space, and if cluster analyses can be wrong, words can also be wrong.


This post is a summary of / is based on Eliezer Yudkowsky’s essay sequence, “A Human’s Guide to Words“.

PDP 3

This week, I went even further in depth into doing statistical analyses in Python. I learned how to do logistic regressions and cluster analyses using k-means. I got a refresher on linear algebra, then used it to learn about the NumPy data type “ndarray”.

Logistic regressions are a bit complicated. The course I used explains it in a kind of strange way, which probably didn’t help. Fortunately, my mom knows a decent amount about statistical analyses (she used to be a researcher), so she was able to clear things up for me.

You do a logistic regression on a binary dependent variable. It ends up looking like a stretched-out S, either forwards or backwards. Data points are graphed on one of two lines, either y=0 or y=1. The regression line basically demonstrates a probability: how likely is it that you’ll pass an exam, given a certain number of study hours? How likely is it that you’ll get admitted to a college, given a certain SAT score? Practically, we care most about the tipping point, 50% probability, or y=0.5, and what values fall above and below that tipping point.

This can be slightly confusing since regression lines (or curves, for nonlinear regressions) usually predict values, but since there are only two possible values for a binary variable, the logistic regression line predicts a probability that a certain value will occur.

After I finished that, I moved on to K-means clustering, which is actually surprisingly easy. You randomly generate a number of centroids (generic term for the center of something, be it a line, polygon, cluster, etc.) corresponding to the number of clusters you want, and you assign points to centroids based on least Euclidean distance, move the centroids to the center of those new clusters, then assign the points to the centroids a second time.

Linear algebra is a little harder to understand, especially if your intuition isn’t visual like mine is. In essence, the basic object of linear algebra is a “tensor”, of which all other objects are types. A “scalar” is just an ordinary integer; a “vector” is a one-dimensional list of integers, and a “matrix” is a two-dimensional plane of integers, or a list of lists. These are tensors of type 0, 1, and 2, respectively. There are also tensors of type 3, which have no special name, as well as higher-order types.

I learned some basic linear algebra in school, but I figured it was a bit pointless. As it turns out though, linear algebra is incredibly useful for creating fast algorithms for multivariate algorithms, with many variables, many weights, and many constants. If you use standard integers (scalars) only, you’d need a formula like:
y1 + y2 + … + yk = (w1x1 + w2x2 + … + wkxk) + (b1 + b2 + … + bk).
But if you let all relevant variables be tensors, you can simplify that formula to:
y = wx + b

There are a handful of other awesome, useful ways to implement tensors. For example, image recognition. In order to represent an image as something the computer can do stuff with, we have to turn it into numbers. A type 3 tensor of the form 3xAxB, where AxB is the pixel dimension of the image in question, works perfectly. (Why use a third dimension of 3? Because images are commonly represented using the RGB, or Red/Green/Blue, color schema. In this, every color is represented with different values of R/G/B, between 0 and 255.)

Tensors, in the context of NumPy, which has a specific object type which is designed to handle them, are implemented using “ndarray”, or n-dimensional array. They’re not difficult to implement, and the notation is for once pretty straightforward. (It’s square brackets, similar to the mathematical notation.)

This should teach me to think of mathematical concepts as “pointless”. Computers think in math, so no matter how esoteric or silly the math seems, it’s part of how the computer thinks and I should probably learn it, for the same reasons I’ve devoted a lot of time to learning about all humans’ miscellaneous cognitive biases.

I’ve asked a handful of the statisticians I know if they wouldn’t mind providing some data for me to do some analyses of, since that would be a neat thing to do. But if I don’t do that, this coming week I’ll be learning in depth about AI, which my brain is already teeming with ideas for projects on. I’ve loved AI for a long time, and I’ve known how it works in theory for ages, but now I get to actually make one myself! I’m excited!